|
SCuM
Turn on LC divider, change radio to RxEnable state, configure to one frequency setting
Setup a periodic timer with RFTimer for 1ms, when the timer interrupt fired:
read the LC div counter and store in a buffer
when the buffer is full (10 sample points), calculate the average value and print out along with the current frequency setting, then clear the buffer and update to another frequency setting
Conduct the same experiment but setting radio to TxEnable state
Each experiment lasts for 1*10*32*32*32 = 327.680 seconds
1: 1ms interval to read the LC div counter
10: 10 LC div counter reads (sample point)
32*32*32: number of frequency settings
The experiment is conducted twice: one when radio is set to RxEnable state, one is set to TxEnable.
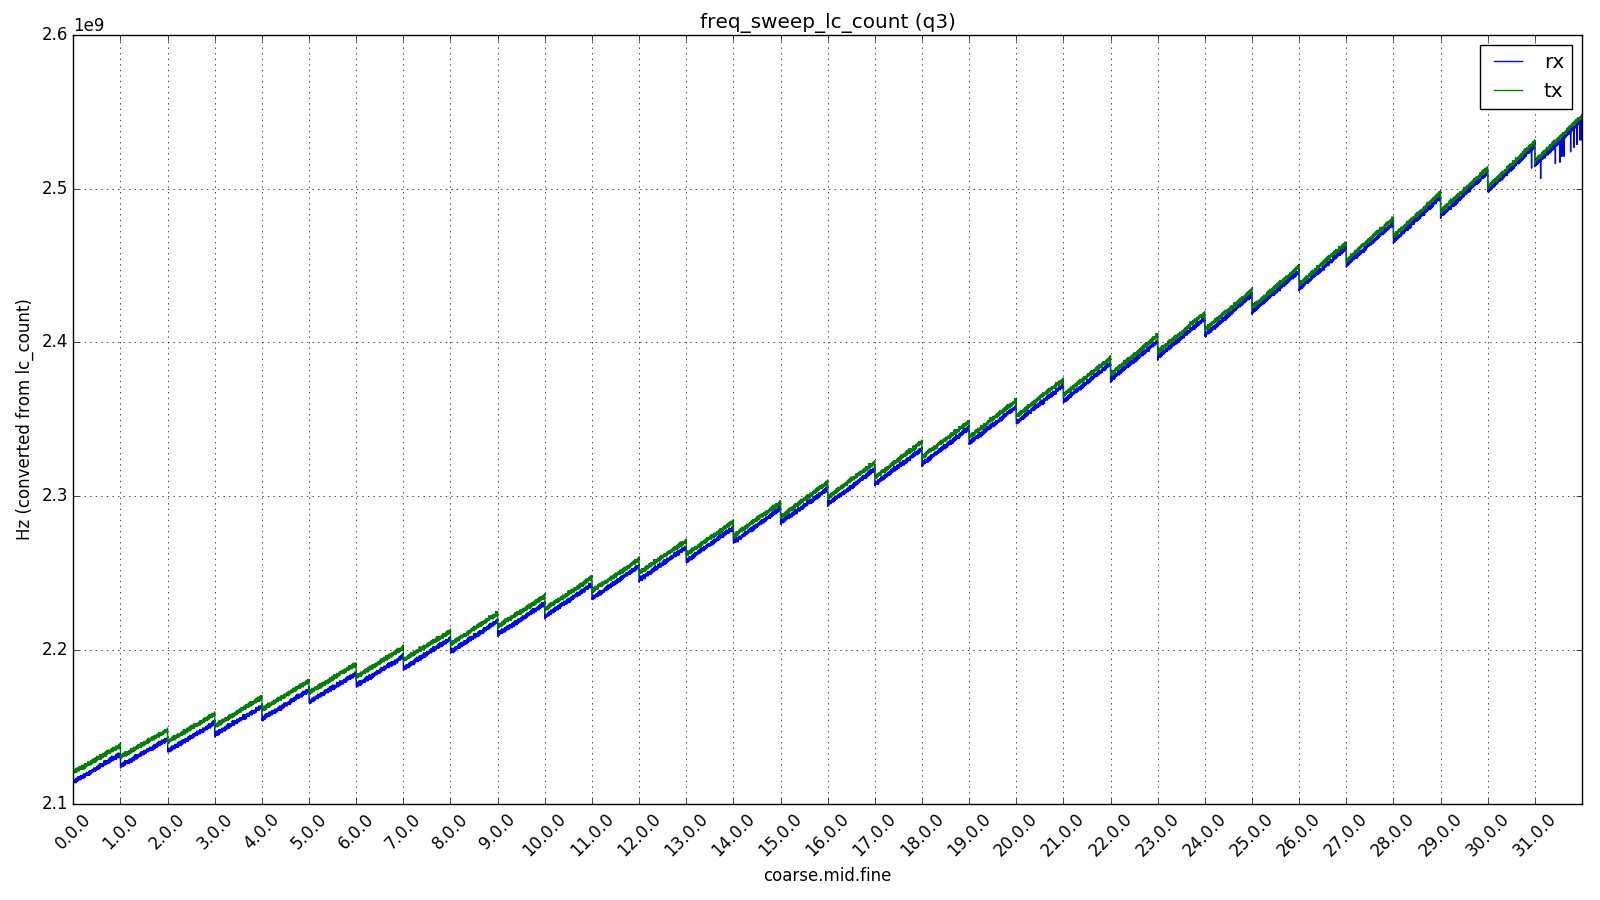
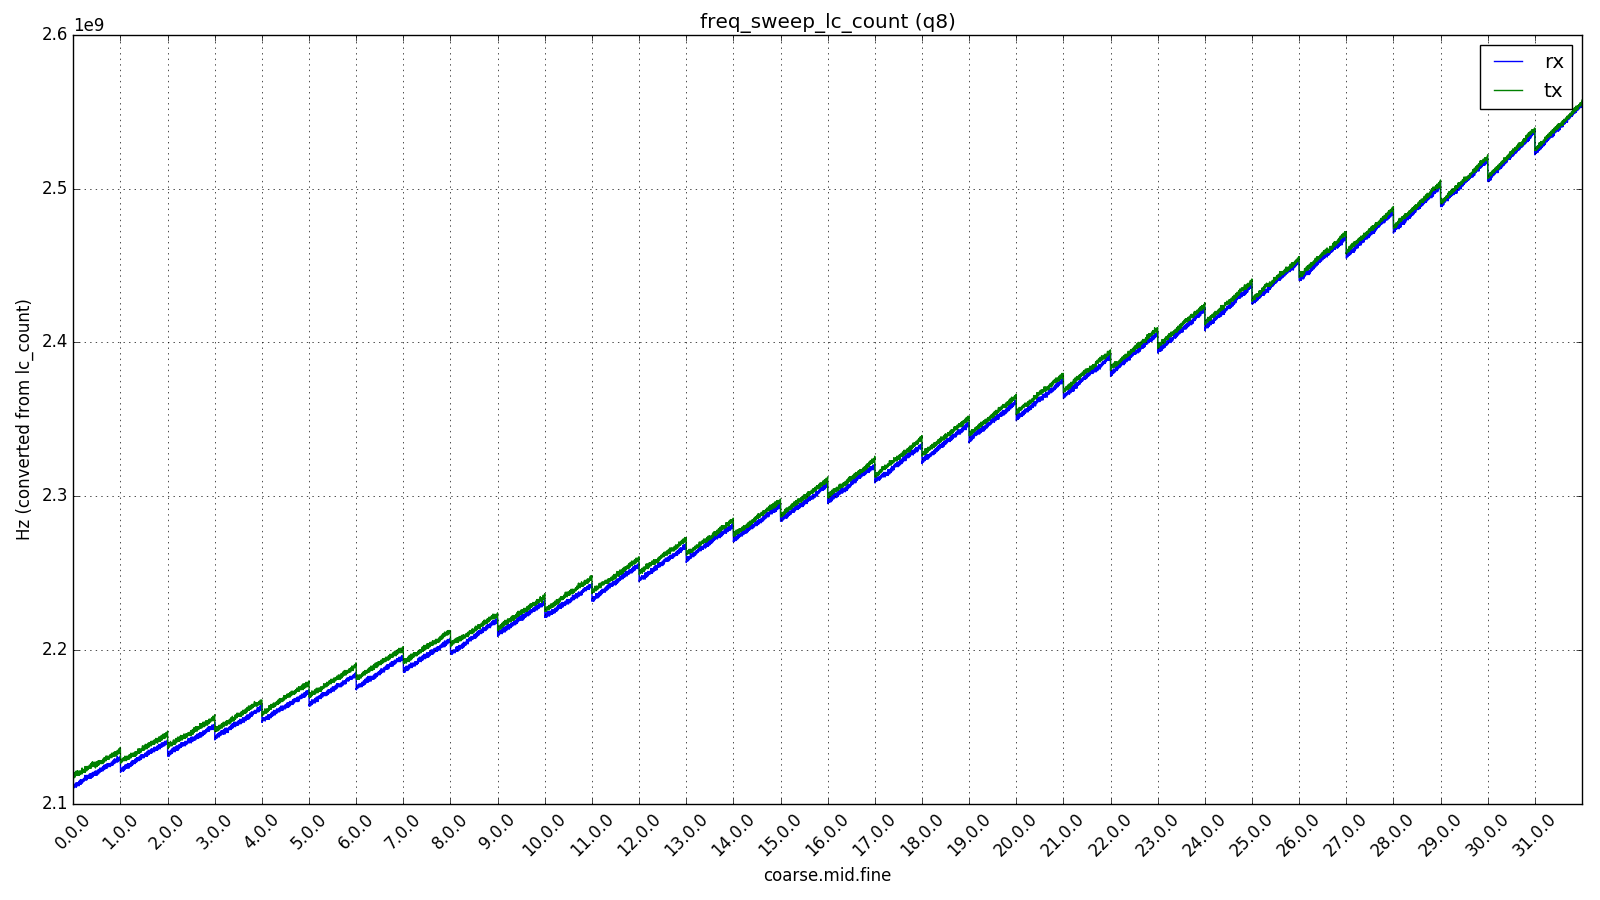
16 plots (one for Rx setting, one for Tx setting), where:
Y: LC frequency (translated from LC_count)
X: frequency settings (from 00.00.00 to 31.31.31)
The LC div counter is sourced from the LC clock after dividing by 960. This means that LC_count=2300 after 1ms translates into frequency 2300*960/0.001 = 2,208,000,000 Hz |


The JSON file contains the LC_count for both Q3 and Q8 boards at TX and RX states.
OpenMote
listens on one channel, all the time.
Prints out the payload of any packet it receives and the frequency offset reader from FREQEST register.
SCuM:
Sends 3 frames at each frequency settings [coarse,mid,fine]
A frame is sent every 5 ms
The frame payload contains test.xx.yy.zz, where xx.yy.zz indicates “coarse.middle.fine”
For each channel, the experiment lasts for 3*5*32*32*32 = 491.520 seconds
3: 3 frames each frequency settings
5: 5 ms sending interval
32*32*32: number of frequency settings
The experiment is repeated 16 times on different channels.
16 scatter figures (one figure per channel), where:
Y: frequency offset (read value of FREQEST register)
X: frequency settings (from 00.00.00 to 31.31.31)
The results of Q8 board are shown here as an example |
Tips:
Q: Why there are 2 bars in most of the results?
A: That is because of the non-monotonic feature of LC frequency settings. Referring to the LC_count result above, each time the coarse increments, the actually LC frequency drops, resulting two bars on two adjacent coarse settings.
Q: Why there sometimes is another bar of outliers?
A: This is because of the abnormal behaviors of CC2538 chip that it receives frames from other channel rather than the one it listens to. By checking the signal strength of each frames received by OpenMote, the bar outliers responds to frames with low RSSI value (<-85dbm), while the other bars responds frames with RSSI value >-50dbm.


The freq_sweep_tx_result.json files contain the frequency settings and freq_offset of each received frames.
SCuM
Listens on one frequency setting for 15ms, then changes to another frequency setting.
Prints out the frequency setting when a valid frame is received.
OpenMote:
Constantly send one frame every 7.5ms on one channel
For each channel, the experiment lasts for 15*32*32*32 = 491.520 seconds
15: 15ms duration to listen on one frequency setting
32*32*32: number of frequency settings
The experiment is repeated 16 times on different channels.
16 histogram figures (one figure per channel), where:
Y: number of pkt received
X: frequency settings (from 00.00.00 to 31.31.31)


The freq_sweep_rx_result.json files contain the frequency setting of each received frames.
Using the same code running for Frequency Sweep experiment above but under conditions when LC divider is turned on and turned off.
The experiment runs one time for channel 11, 18 and 26 respectively
6 histogram figures (one figure per channel), where:
Y: frequency offset (read value of FREQEST register)
X: frequency settings (from 22.00.00 to 29.31.31)
Divider off

Divider on

Divider off

Divider on

Divider off

Divider on

6 histogram figures (one figure per channel), where:
Y: number of pkt received
X: frequency settings (from 22.00.00 to 29.31.31)
Divider off

Divider on

Divider off

Divider on

Divider off

Divider on

The zip file contains the serial output from OpenMote, and SCuM during conducting the frequency sweep tests. The raw data provided above are derived from those serial output and formatted in JSON through scripts. So you should not required to use those serial output information data. Just stored here in case.
freq_sweep_lc_count.zip contains the lc_count test serial output of both q3 and q8 board.
freq_sweep_q8.zip contains the Q8’s freq_sweep test serial output for both TX and Rx.
freq_sweep_q3.zip contains the Q3’s freq_sweep test serial output for both TX and Rx.